
Best Glassnode Alternatives in 2026
Dune Analytics offers free basic access compared to Glassnode's $49 entry fee. Switch if you need custom community dashboards rather than pre-built on-chain charts.
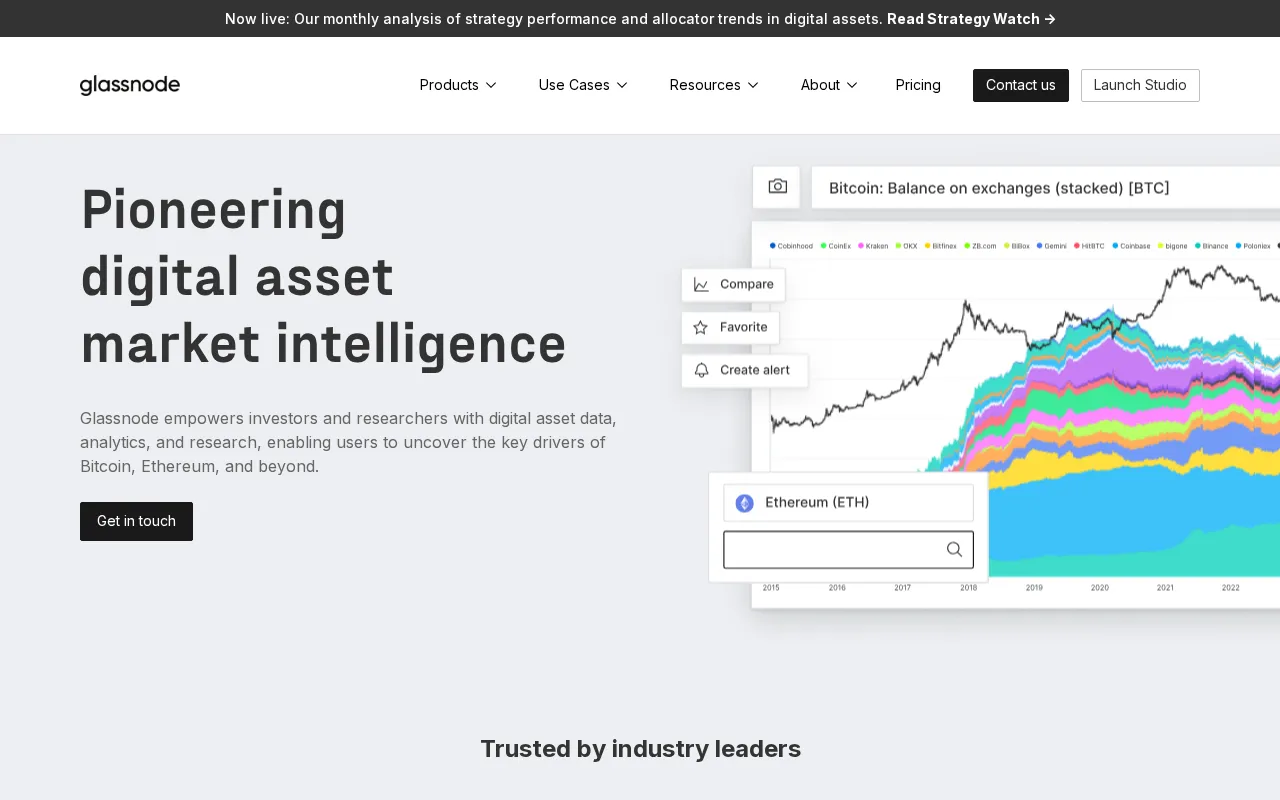
Feature Overview: Top Glassnode Alternatives
Glassnode compared against all 7 crypto analytics alternatives. Pricing, free plan availability, rating, and crypto analytics-specific capabilities.
| Tool | Price | Free Plan | Rating |
|---|---|---|---|
 | $99/mo | No | 4.5G2 |
 | $75/mo | 4.6G2 | |
 | $69/mo | 4.5G2 | |
 | $29/mo | 4.4G2 | |
 | Pay-as-you-go | 4.3G2 | |
 | $49/mo | 3.8G2 | |
 | $350/mo | - | |
 | Pay-as-you-go | - |
How Does Glassnode Compare to Alternatives?
Independently verified metrics. Sources: Vendor documentation, independent research. Verified 2026.
| Tool | Data Granularity | Wallet Syncs | Chains |
|---|---|---|---|
| Glassnode (this) | tick | 12 | 5 |
| Dune Analytics | block | 12 | 30 |
| Nansen | block | 12 | 35 |
| CoinGlass | 1m | - | - |
| Messari | 1d | 86,400 | 50 |
| Santiment | 1h | 3,600 | 25 |
| Token Terminal | 1d | - | - |
| Sentora | 1h | - | 30 |
When Should You Stick with Glassnode?
Alternatives are not always the right move. Glassnode remains strong in these scenarios.
- +Deepest BTC/ETH on-chain metric library available
- +Excellent weekly Glassnode Insights research reports
- +Institutional-grade data trusted by funds worldwide
- +Full API access for developers and quants
- -Steep tier jump: Advanced runs $49 to $99 a month, then Professional lands near $999 a month billed annually
- -BTC/ETH depth drops sharply for other chains
- -No free tier: the retired Standard plan is gone, so trying Glassnode means paying for Advanced
- -Some indicators require deep on-chain knowledge to interpret
Glassnode Alternatives by Chain & Use Case
7 alternatives evaluated by features, pricing, and real-world use cases.
Expert Take
Billing splits monthly from yearly by half: Studio Advanced is $99 month to month and $49 on the annual commitment. The API on that tier is a fourteen-day stub, and the real one runs on Data Credits, one per Bitcoin call, two per altcoin.
 Oleh KemFounder & Lead Analyst
Community-powered blockchain analytics platform with SQL-based queries and customizable dashboards for any on-chain data. Rated 4.7/5 vs 4.6/5 for Glassnode.
- +Free and powerful for most analytical use cases
- +Huge community dashboard library across all major chains
- +Multi-chain SQL analysis with decoded tables
- +New dashboards appear rapidly after major market events
- −Requires SQL knowledge to write custom queries
- −Free tier has query execution limits and can be slow
- −Community dashboards may contain errors or become stale
Blockchain analytics platform with smart money tracking, wallet labeling, and real-time alerts for DeFi and NFT activity. Starts cheaper at $69/mo vs $99/mo.
- +100M+ labeled wallets for smart money tracking
- +Real-time alerts on whale and fund movements
- +Multi-chain coverage across Ethereum, BNB Chain, and others
- +Token God Mode for deep holder analysis
- −Wallet label accuracy isn't perfect - some stale or incorrect
- −Better for swing/positional trades than scalping
- −Can generate false conviction on misleading wallet signals
Cryptocurrency derivatives data platform with liquidation maps, funding rates, open interest, and exchange flow analytic. Starts cheaper at $29/mo vs $99/mo.
- +Best liquidation heatmap in the space
- +Real-time funding rates across 10+ exchanges
- +Options data including max pain and put/call ratio
- +Most derivatives metrics available on free tier
- +Liquidation Maps
- +Funding Rate Analytics
- −Minimal on-chain analytics - not a Glassnode replacement
- −UI is dense and can overwhelm newer traders
- −Some data has delay on free tier
Crypto research and data platform with protocol-level analytics, governance tracking, and institutional research reports. Glassnode edges it on ratings (4.6 vs 4.4/5).
- +Institutional-quality protocol research reports
- +Fundraising data and valuation tracking
- +Governance monitoring across major DAOs
- −Not a trading signals or charting tool
- −Free tier heavily limited
- −Enterprise pricing is expensive
Crypto behavior analytics platform with social sentiment, on-chain, and development activity metrics.. Glassnode edges it on ratings (4.6 vs 3.9/5).
- +Best-in-class social sentiment and narrative tracking
- +Development activity metric for project health monitoring
- +Whale transaction and on-chain flow alerts
- +SAN token discount mechanism for long-term users
- −Social signals are noisy - require careful interpretation
- −Depth drops significantly for smaller altcoins
- −Less comprehensive on derivatives/futures data
Financial analytics platform for crypto protocols with revenue, earnings, and valuation metrics similar to traditional f. Priced higher at $350/mo vs $99/mo.
- +Traditional finance metrics (P/S, P/F) applied to DeFi protocols
- +Standardized revenue and earnings tracking across sectors
- +Clean API for programmatic data access
- +Useful for relative valuation between competing protocols
- +Crypto Protocol Tracking
- +Real-time Revenue Data
- +Earnings Metrics
- −Fee-to-token-value relationship isn't always straightforward
- −Thinner coverage for newer protocols and chains
- −No on-chain flow or sentiment data
Crypto analytics platform with AI-driven insights, on-chain indicators, and DeFi analytics..
- +Best In/Out of the Money holder distribution analysis
- +Large transaction (whale) movement tracking
- +DeFi protocol usage and liquidity pool analytics
- +Free tier with meaningful metric access
- +AI-driven Market Insights
- −AI signal accuracy lacks transparent backtesting data
- −Coverage drops sharply for smaller altcoins
- −Less depth than Glassnode for on-chain metrics
Common Questions About Switching from Glassnode
Sources & verification
| Source | What was checked | Last checked |
|---|---|---|
| Official Website | Official vendor website | — |
| Official Pricing Page | Source of verified tiers | July 16, 2026 |
Every fact on this Glassnode pricing page is tied to a named source and a verification date. Freshness-sensitive figures trace to the sources above; verify against the vendor before relying on them.